Intel Advisor Roofline Example
Background:
Steps to Test the Roofline Toolkit
Steps:
- Launching the Roofline Toolkit (GUI):
- export PATH="/usr/local/intel/oneapi/advisor/latest/bin64:$PATH"
- advixe-gui

- Creating a new project
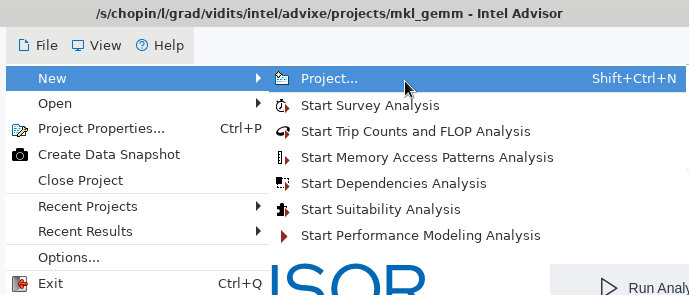
- Click on File > New > Project

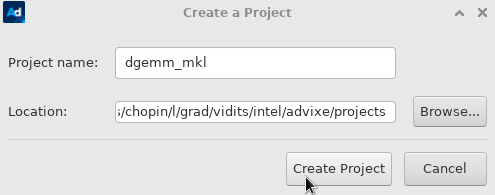
- Set a Project Name

- Selecting Binaries
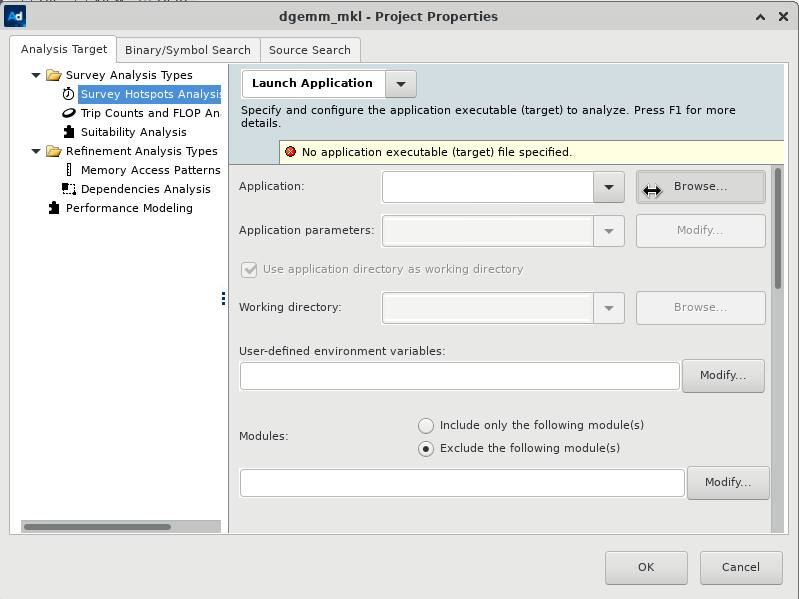
- Select the Survey Hotspot Analysis tab and click on Application > Browse. Select your binary in the new window

- Start Data Collection
- Select the CPU / Memory Roofline Insights button

- Select the desired Accuracy and click on the Play button to start data collection. (Tests with higher overhead repeat experiments to report consistent results)

- Viewing Results
- Navigate to the "Survey & Roofline" Tab. Then click on "Roofline" to see the roofline chart

- The Red circle represents the part of code where the most amount of time is spent
- Look at the "source" section to identify the part of code which consumes the most time. (The -g flag must be enabled during compilation to see this)
Created by Vidit Save 1/30/2023

