Dealing with Artifacts
Here is the plot of EEG at the end of Getting Started with EEG Data.
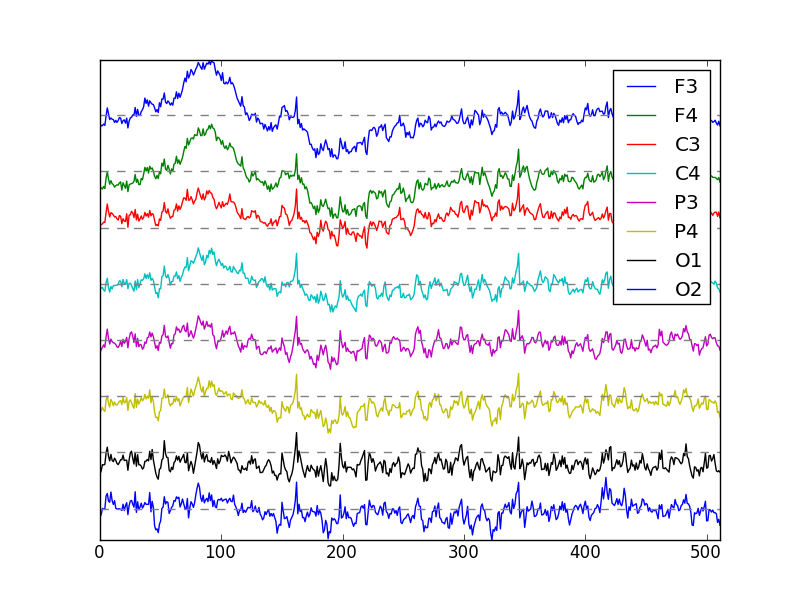
Looks like we have an eye-blink artifact near sample 100.
Bandpass Filtering
One way to decrease the effect of eye blinks is to filter the data. Here is a link to the file bandpass.py, adapted from ObsPy, that defines the function bandpass. We can use it to pass frequencies from 1 to 30 Hz as follows:
In [1]: import json

In [2]: import numpy as np

In [3]: import matplotlib.pyplot as plt

In [4]: import bandpass as bp

In [5]: data = json.load(open('s20-gammasys-gifford-unimpaired.json','r'))

In [6]: first = data[0]

In [7]: eeg = np.array(first['eeg']['trial 1'])

In [8]: filtered =  bp.bandpass(eeg[:8,:], 2,30, 256, corners=5, zerophase=True, axis=1)

In [9]: plt.figure(3);

In [10]: plt.plot(filtered[:8,4000:4512].T + 80*np.arange(7,-1,-1));

In [11]: plt.plot(np.zeros((512,8)) + 80*np.arange(7,-1,-1),'--',color='gray');

In [12]: plt.yticks([]);

In [13]: plt.axis('tight');

In [14]: plt.legend(first['channels']);
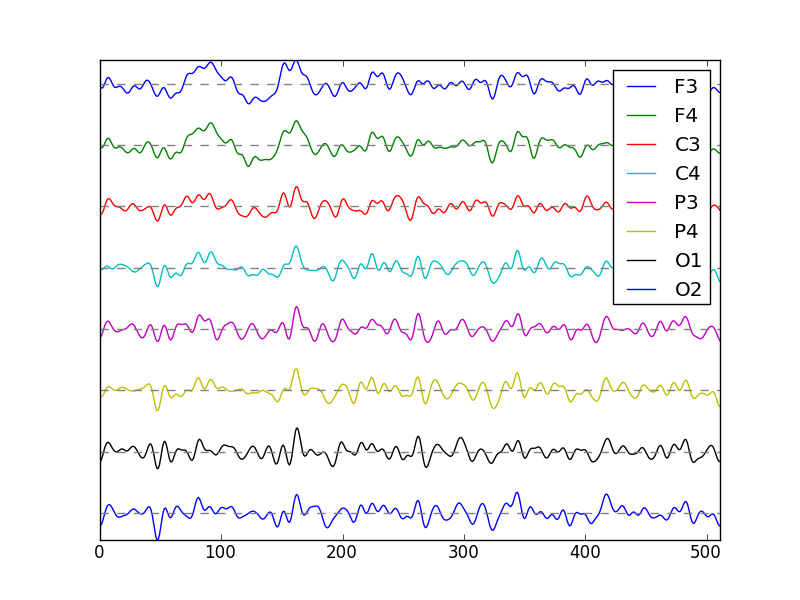
There still seems to be a little eye blink present. Unfortunately, bandpass filtering filters each channel independently, so we cannot use information about the relative amplitudes among the channels. Eye blinks tend to affect channels near the front the scalp more. Methods that extract this pattern would do a better job of removing eye blinks, such as Signal Fraction Analysis (SFA).